- Welcome to LEC Forum.

Recent posts
#21
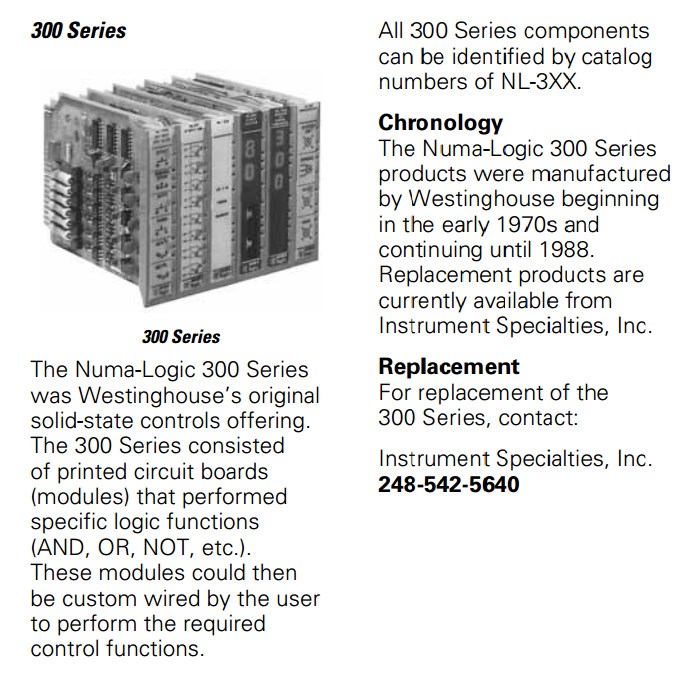
Numa Logic Programmable Controllers / NL-300 Information
Last post by Dave Loucks - November 30, 2016, 08:20:16 AMNuma-Logic NL-300 series control was a system of separate cards, with each card having a separate function (AND, OR, Flip-Flop, etc.) These cards were mounted in a rack and the "logic" was performed by connecting various gates and circuits of each card together using wire-wrapping techniques.
Manuals and other documentation is available at: http://www.pps2.com/communications/NL300.php
Manuals and other documentation is available at: http://www.pps2.com/communications/NL300.php
#22
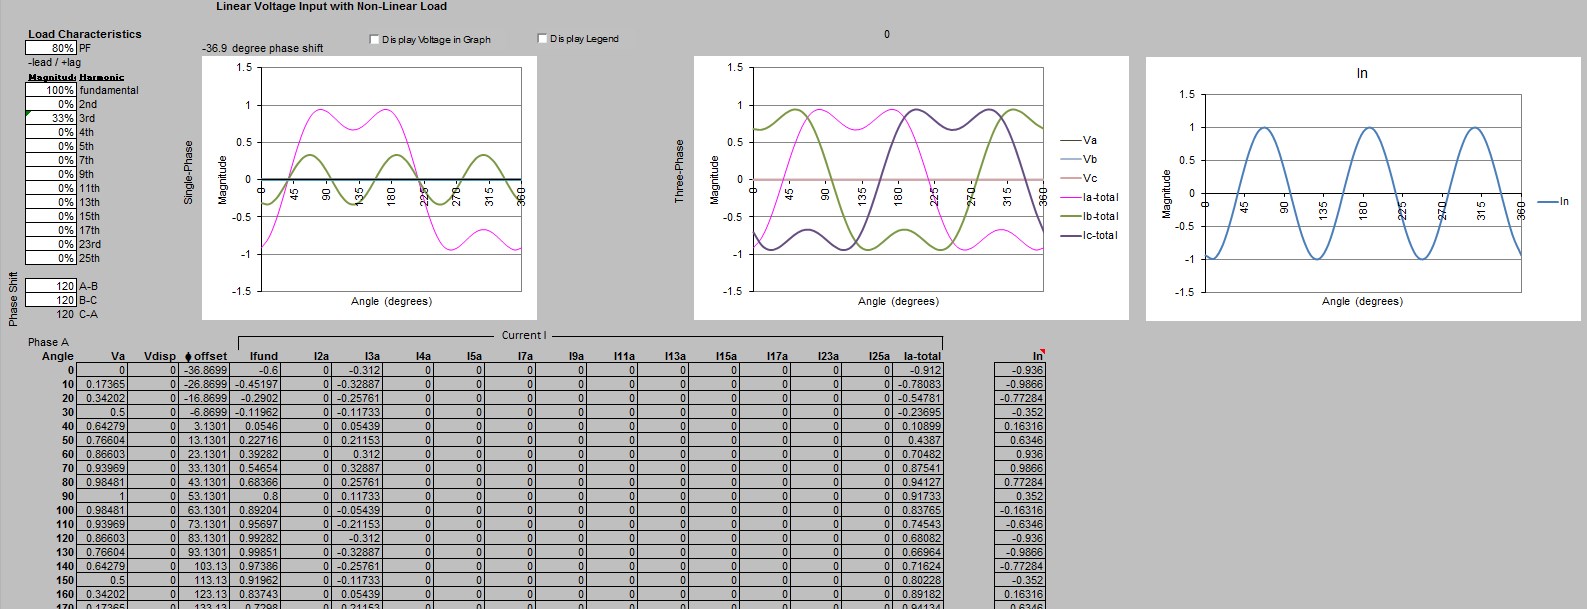
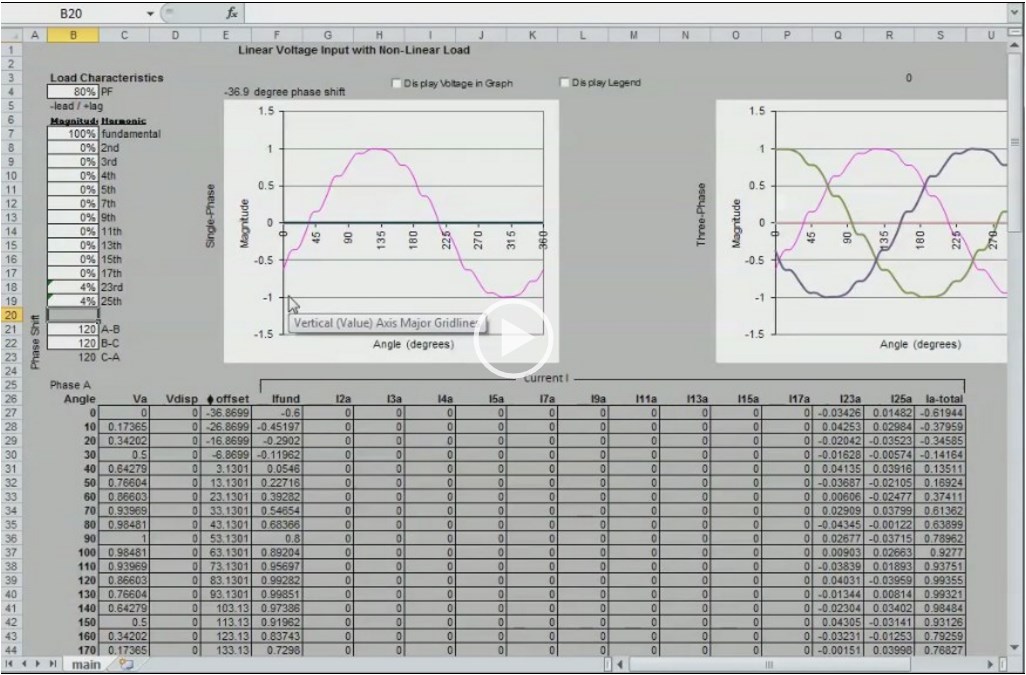
3-Phase Power / Using Phase Shifting to Cancel...
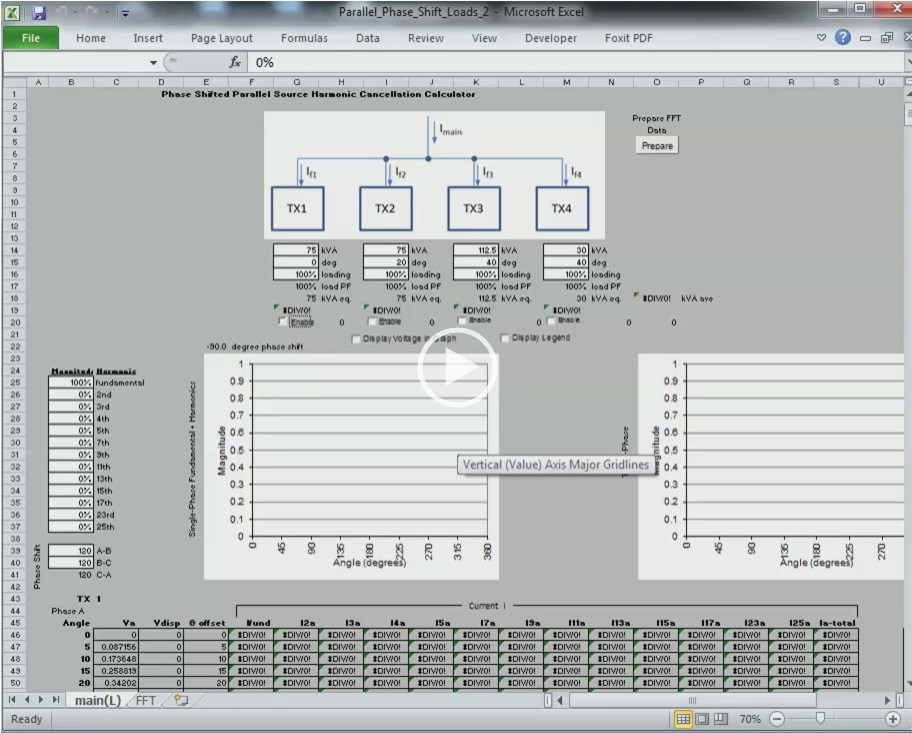
Last post by Dave Loucks - November 22, 2016, 09:40:51 PMPutting some loads downstream of transformers that have different phase shifts is a well-known method of cancelling harmonics. But how much cancellation? And what amount of phase shift should I use -- 15 degrees, 20 degrees, 30 degrees, 45 degrees?
To answer that question I created a calculator that allows you to select from 1 to 4 parallel transformers, each with programmable kVA rating and phase shift, and measure the amount of harmonic attenuation you might see in such a configuration.
Take a look at the 9-minute tutorial video on how these programs work and download them from the links below.
Attached a later version (V3) to add 17th & 19th harmonics and clean up some errors that occur if you selected 3 or 4 parallel transformers.
#23
Power Xpert Meter / Power Xpert Multi-Point (PXMP)...
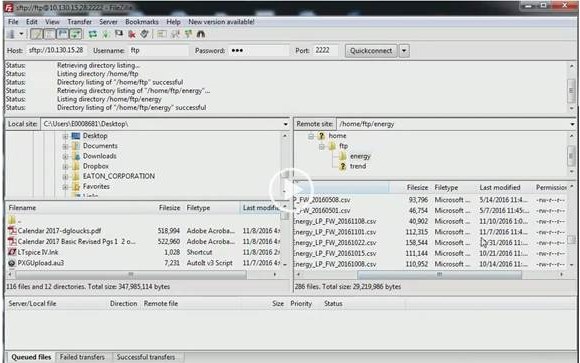
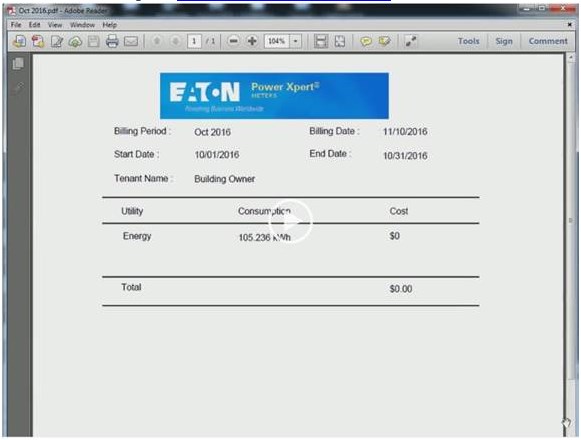
Last post by Dave Loucks - November 10, 2016, 02:48:55 PMNeed to get any information from the Energy Portal Module in the PXMP? You can FTP (actually SFTP, which is FTP running through an SSH tunnel) directly to the file structure in the meter and download the files.
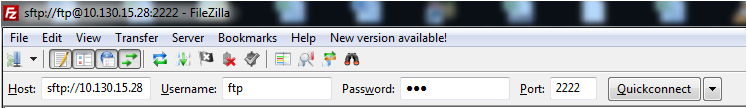
Here's an example using FileZilla (this address is behind the Eaton firewall so unless you work for Eaton just consider this an example... you will substitute your device's actual IP address)
Host: sftp://10.130.15.28 (assume you are behind the Eaton firewall for this test)
Username: ftp
Password: ftp
Port: 2222
Here's a video showing step-by-step how you access those files: https://pps2.com/v/s/1/occn1.php
EAllocation Software
Eaton also offers a more automated method of collecting these files. Just download the free EAllocation software. You can also download the manual.
EAllocation will automatically extract (via behind the scenes SFTP) and calculate kWh by month, by meter, by user. You can then export, print or email this data.
Here's another video / screencast I made showing how to use this software to download and allocate energy: https://pps2.com/v/s/1/occn2.php
#24
Power Xpert Meter / Java and Internet Explorer Con...
Last post by Dave Loucks - September 23, 2016, 09:00:43 AM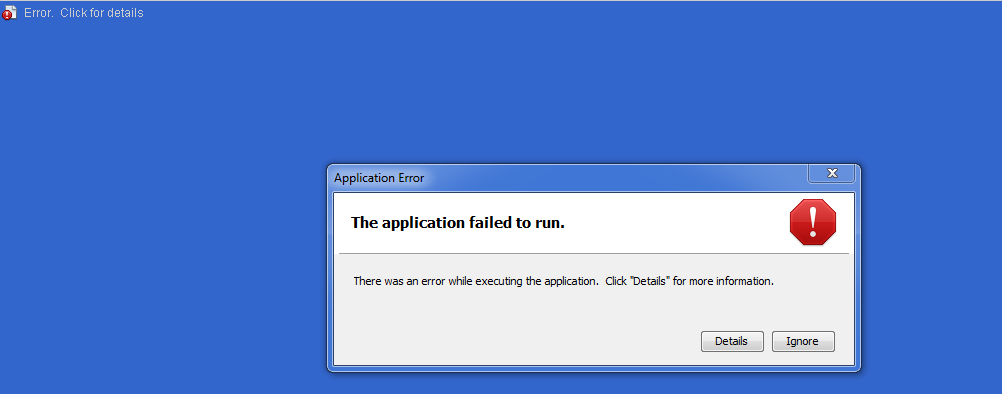
Having trouble connecting to versions of the Power Xpert 4000, 6000 or 8000 (4/6/8K) meters using the Java applet served from the PXMs? The HTML5 version of the PXM doesn't have these problems, but if you have problems connecting to the Java version of the meter, you may have a Java security setting issue.
Take a look at the attached document for fixing that (and other) problems.
#25
Modbus / Modbus MINT (Modular INCOM Net...
Last post by Dave Loucks - September 20, 2016, 10:57:35 AMWhen trying to wire power to the mMINT, it may not be completely obvious which wire connects where. Here is the diagram from the Eaton instruction booklet for the mMINT:
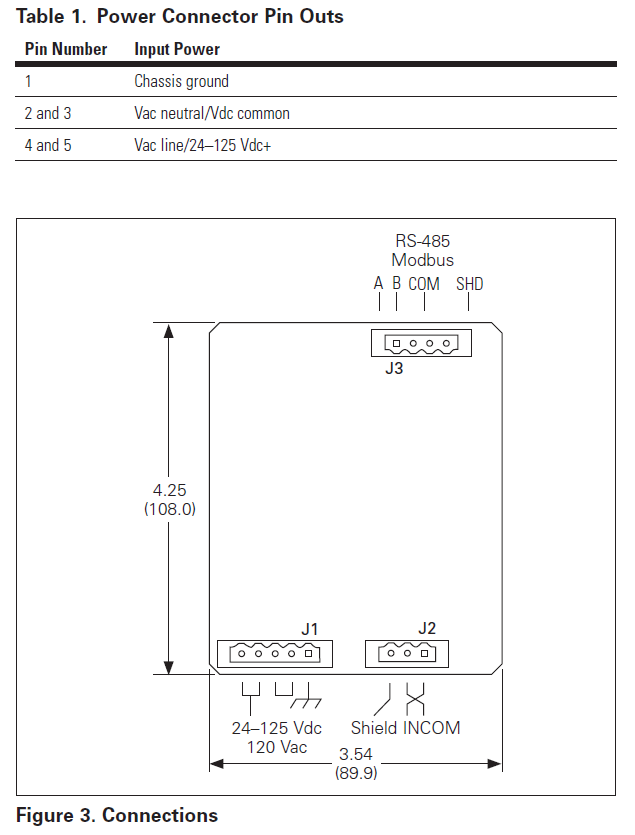
Perhaps this diagram will make it clearer:
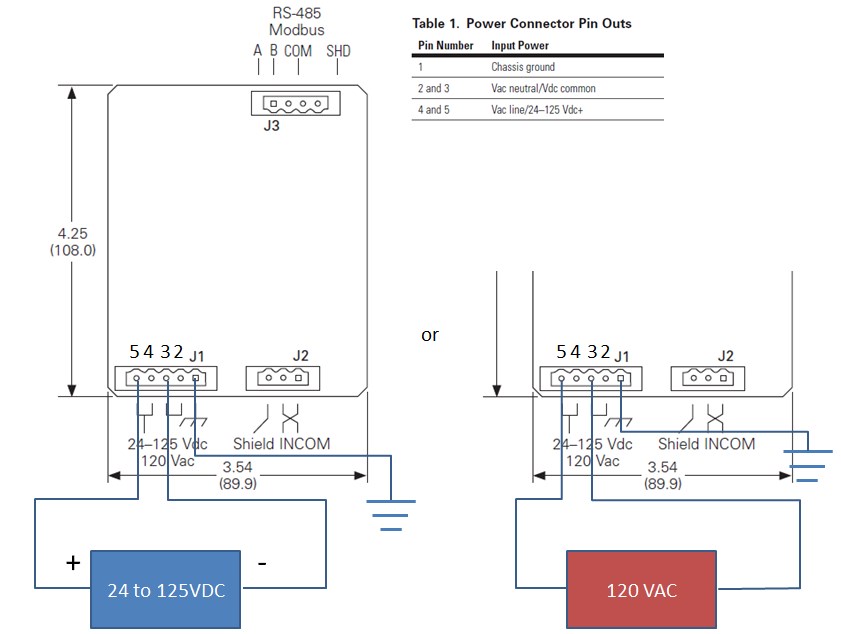
You can ground the ac neutral or the dc common to the same terminal 1 on the J1 terminal block.
You can download a larger version immediately below.
Perhaps this diagram will make it clearer:
You can ground the ac neutral or the dc common to the same terminal 1 on the J1 terminal block.
You can download a larger version immediately below.
#26
Modbus / Re: Modbus MINT (Modular INCOM...
Last post by Dave Loucks - September 16, 2016, 03:41:07 PMHaving trouble talking to an mMINT and you've tried all the other steps in this section?
The trouble might be with "self-powered" 232-485 converters connected to industrial automation, protective relays or other devices with EIA-232 ports.
You can read more here.
The trouble might be with "self-powered" 232-485 converters connected to industrial automation, protective relays or other devices with EIA-232 ports.
You can read more here.
#27
Modbus / Troubleshoot EIA 485 Biasing a...
Last post by Dave Loucks - September 16, 2016, 02:07:27 PM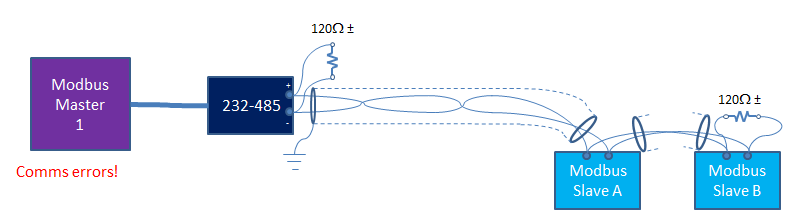
Recently I was involved in the troubleshooting of multiple Modbus networks that were identical in devices, distances, programming, configuration, and termination resistance, but on some of the networks, there would be no communications.
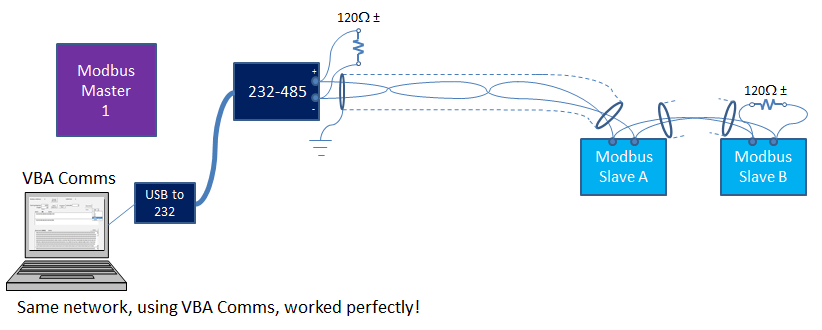
Interestingly, when a Modbus test program (VBA Comms) replaced the existing Modbus master on the non-functioning network (using the same line driver used by the SCADA master), all the devices talked!
This pointed to something being wrong with the SCADA master.
But before you jump to that conclusion, allow me to complicate things by performing another test.
In this test the existing SCADA master was reconnected, but "known good" Modbus slave devices from functioning networks replaced the Modbus slave devices on the non-functioning network. The existing SCADA master was able to talk to them fine!
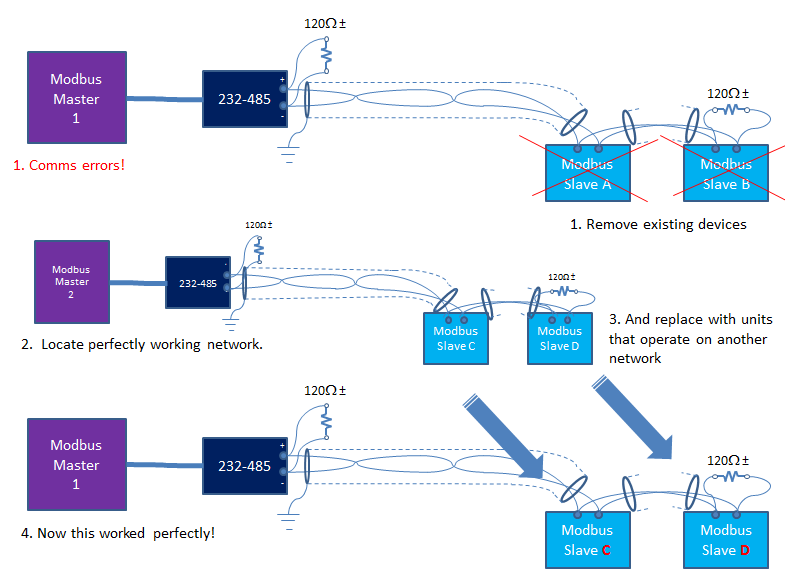
So, in the first case, it appeared that something was wrong with the SCADA master, but in the second, it looks like something is wrong with the slaves.
- VBA Comms as SCADA master
All slave devices worked on all networks
- Existing SCADA master
Some slave devices worked with all SCADA masters
Some slave devices would not work with any SCADA masters
What is going on?
The problem was believed to be (but not expressly confirmed as of this date) that the signal levels on the "bad" network was right at the ragged edge of being detectable at the slave devices.
Then why did the laptop running VBA Comms always work?
The belief is that the SCADA master, that master's line driver -- which turned out to be self-powered from current provided by that SCADA master -- and the slave device internal loading impedance all played a role.
The Rest of the Story
232 to 485 converters that don't require external power supplies are less expensive and easier to install than converters that require external power. The "self-powered" units operate by extracting voltage from one of the 232 pins that is expected to be high (e.g. DTR pin) and use this signal to not only power the line-driver's electronic circuitry, but also to have enough left over to send a 485 signal (with sufficient amplitude) down the 485 network to all the connected devices and termination resistances.
Since 485 networks require signals greater than 300 mV and since most 232 ports provide more than 5-12 volts, normally there should be no problem.
The problem occurs when the 232 source voltage is current limited, or must provide current for other loads (which might vary, contributing to the maddeningly intermittent nature of this problem).
If the line driver electronics draws too much load, or if the load impedance of the network is too low, or if the sourcing 232 device voltage (or available current) varies, the voltage on the 485 network can be too low to be detected reliably by the other 485 devices. Recall that any voltages less than 300 mV (i.e. between -300 mV and +300 mV) are undefined in the 485 spec.
Undefined voltages will result in symptoms such as "framing errors" on received messages.
For short networks (<1000 feet, 300m end-to-end), one quick fix is to remove one or both termination resistors.
Removing the termination resistances will reduce the load on the biasing circuit in the line driver (232/485 converter) and the signal levels will increase, potentially fixing the problem, as it did in this application. Because of the intermittent nature and how long it took to resolve, the customer couldn't spend any more time performing "post-fix" voltage checks, so we are not sure how close to the 300 mV we were before and how much margin we had after.
If this happens to you and in the case you are using the Modbus MINT as a network slave device, you can detect this framing error problem by interrogating the "Table 6" registers within the mMINT using the VBA Comms tool. The smoking gun is an increase in the number of UART framing errors reported.
- Connect your computer running VBA Comms as the Modbus master on the "bad" network.
Verify able to communicate to the mMINT.
- Press the "Send Reset" button found on the mMINT tab in VBA Comms.
This will reset all the error counters to zero (assuming you actually originally had good communications from VBA Comms to the mMINT in the first place!)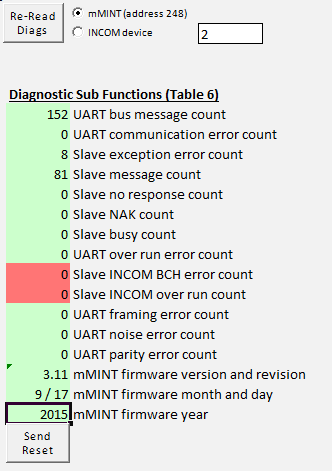
- Disconnect VBA Comms and reconnect to the existing Modbus master that can't talk to mMINT. Let it attempt to poll for a while (collect about 20-30 flashes on the Modbus Rx light on the mMINT).
- Disconnect the Modbus master and reconnect VBA Comms
- Press the Re-Read Diags button.
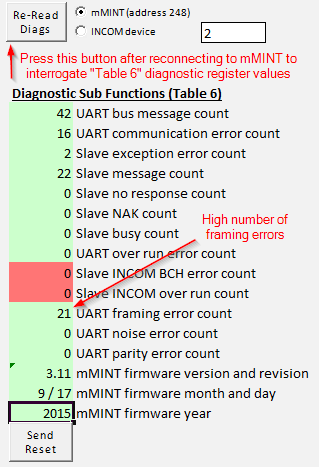
- What values are the highest value?
If "UART framing error" is a large value, and assuming you have selected the proper bit rate in this program to match that of the master and the slaves, then likely the networking biasing issue is to blame. As mentioned above, if the network is short (<1000 ft, 300 m), remove one or both termination resistors as a possible work around
The proper fix is to use a line driver that can output sufficient signal. If the 232 device you have connected the line driver to cannot provide sufficient current, then substitute the line driver with one that is separately powered.
#28
3-Phase Power / Re: Harmonic Summation (3-Phas...
Last post by Dave Loucks - September 15, 2016, 12:31:44 PMHere's the same application, but this one includes 3-phase plotting.
Here's a video tutorial on how to use this version:
https://pps2.com/v/s/1/3h.php
Here's a video tutorial on how to use this version:
https://pps2.com/v/s/1/3h.php
#29
Career Planning / What I Wasn't Taught In Engine...
Last post by Dave Loucks - September 06, 2016, 11:55:25 AMSchool is great. Not just for the technical education, but for the interaction with professors, peers and others as you learn how to balance the need to complete your assignment, course, paper or project all the while dealing with the other "non-school" issues of life.
But nothing stays the same. As available knowledge in a topic grows, what do you not teach the students? Time is such a precious resource, that knowing how to allocate it wisely for learning is more important than ever.
Life is more than just a (technical) education. Getting one's priorities right helps us navigate better.
After pondering this for a while, I thought I'd write down a list of the things I wished I'd paid more attention to in my early years.
If you are interested, I've also copied below an mp3 audio file of me giving this presentation to a group of electrical and computer engineering students at the University of Pittsburgh on 6-SEP-16.
#30
3-Phase Power / LTSPICE Constant Time Base and...
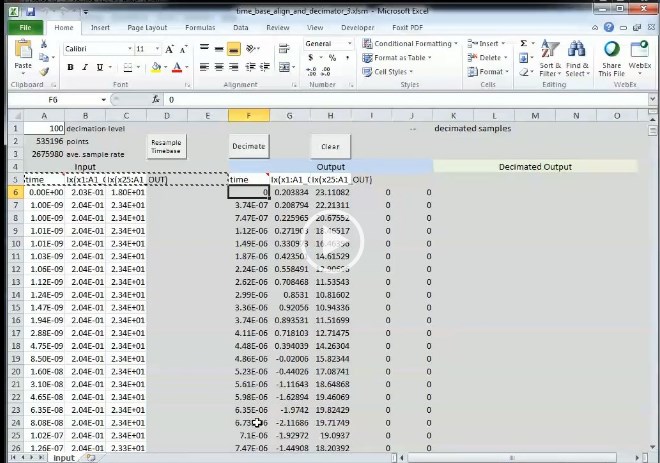
Last post by Dave Loucks - June 27, 2016, 12:31:05 PMWhen running a SPICE simulation, the simulation engine computes a new set of values each sample interval. However, the sample intervals are not constant. Likely to save space, the SPICE engine automatically drops sample rate down when there is less high frequency content.
This is great, except that if someone wants to use the data to compute an FFT, in say Excel, the variable sample rate will not work. Excel's FFT (and pretty much everyone else's!) requires a constant sample rate over the interval.
How do you convert SPICE output with a variable sample rate into a constant sample rate?
One way is to resample at a new constant sample rate. The new sample rate could be something as simple as the number of samples divided by duration of the time interval over which the original data spanned.
So, I would start by reading the first point and copying to a new file, but the second point wouldn't necessarily (probably won't) be the next sampled value from the original data. Instead, the program will discard any sampled data that occurs prior to the next new calculated sample interval. Data that is collected between samples would be linearly interpolated.
At this point the data table output will have constant sample-to-sample time intervals.
But what if those intervals are too short? Maybe your work involves measuring signals in the kHz range, but the sampled data is in the 10's of MHz?
To fix that, you can again resample, but this time you simple skip every so many data points. This in effect simulates an A/D that samples at a lower sample rate. This so-called "decimation" (not precisely correct since decimate implies "1 out of 10" being sampled and we can apply any ratio here) reduces the frequency response of the sampled signal while simultaneously increasing the frequency resolution.
An example spreadsheet is attached below. As I develop later versions, I'll include those too.
Starting with version 5 I sped up the algorithm by not performing as many back-and-forth operations between the underlying VBA code and the worksheet, so it runs quite a bit faster. Also cleaned up some bugs.
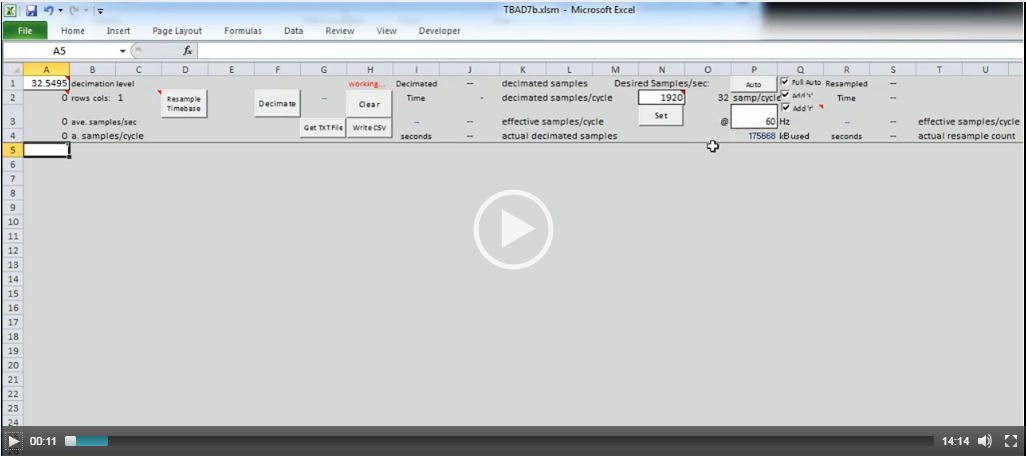
Here's a video tutorial on how to use that resampling and decimator spreadsheet.
I added some new features to this program starting in version 12 (V12), so here's a update tutorial video:

Finally, the program moving past version 12 is being called TBAD.xlsm (Time Base and Decimator). Note that V12 has a memory leak in the "Get Txt File" and the "Auto" function.
V13 (Jan-2018) Fixed the memory leak and added new features. First feature is it supports up to 800 000 rows and up to 36 columns of data. Previously a spreadsheet this sized crashed my 32-bit version of Excel even with 32 GB of RAM. Now I block switch memory in and out and can create spreadsheets of several hundred MB with no problem. Also this new version exports the "full" resolution as well as the decimated version of the resampled data as a CSV file to import into MATLAB or some other post-processing tool. You'll need to edit the path to where you want to store these files (I don't include a dialog... you'll need to edit VBA code... sorry... may add this in a future version.... in the meantime, follow the instructions below to change the path to the output directory for those CSV files.)
Moved to a new naming scheme in early 2018 (TBAD)
Here's a very abbreviated tutorial on the new features. The important thing is that this version runs more reliably. But you'll need to open the VBA editor (like the other versions) and change the path to the destination directory for where you would write the output files created by this program (you can always just copy paste the data from the "resampled" and "decimate" tabs too.)
This is great, except that if someone wants to use the data to compute an FFT, in say Excel, the variable sample rate will not work. Excel's FFT (and pretty much everyone else's!) requires a constant sample rate over the interval.
How do you convert SPICE output with a variable sample rate into a constant sample rate?
One way is to resample at a new constant sample rate. The new sample rate could be something as simple as the number of samples divided by duration of the time interval over which the original data spanned.
So, I would start by reading the first point and copying to a new file, but the second point wouldn't necessarily (probably won't) be the next sampled value from the original data. Instead, the program will discard any sampled data that occurs prior to the next new calculated sample interval. Data that is collected between samples would be linearly interpolated.
Code Select
'Resample data that includes sample-to-sample time variability between  each sample to a new collection where the sample-to-sample time interval is constant

'New Sample Rate = (# of datapoints) / (time interval of sampled data)

Sub ConstTimeConv()
    Dim sAveSampleRate As Single
    Dim sTimeArray(600000, 4) As Single
    Dim sSlope As Single, sB As Single
    Dim i As Long, lPtr As Long
    Dim sStartTime As Single, sEndTime As Single
    Dim lDataPts As Long, k As Long

    lDataPts = Worksheets("input").Range("a2").Value

    'resample variable time series data into constant interval data
    'use linear interpolation between samples to compute value at fixed sample time

    sStartTime = Worksheets("input").Cells(6, 1).Value
    sEndTime = Worksheets("input").Cells(6 + lDataPts - 1, 1).Value
    sAveSampleRate = (sEndTime - sStartTime) / lDataPts
    Worksheets("input").Range("a3").Value = 1 / sAveSampleRate

    lPtr = 6  'preset to first data row
    If lDataPts > 700000 Then lDataPts = 600000

    For i = 0 To lDataPts - 1
        'determine the next sample time value
        sTimeArray(i + 1, 0) = sAveSampleRate * (i + 1)

        'now determine what the sampled value would be for that new time (straight line interpolation)
        'determine slope between sampled values
        'find the next sampled data time that is just barely larger than this next sample time
        Do
            If Worksheets("input").Cells(lPtr, 1).Value > sTimeArray(i + 1, 0) Then
                Exit Do
            End If
            lPtr = lPtr + 1
            If lPtr > lDataPts Then
                Exit Do
            End If
        Loop
        For k = 0 To 2
            sSlope = (Worksheets("input").Cells(lPtr, 2 + k).Value - Worksheets("input").Cells(lPtr - 1, 2 + k).Value) / _
            (Worksheets("input").Cells(lPtr, 1).Value - Worksheets("input").Cells(lPtr - 1, 1).Value)

            'now find b (y-intercept)
            sB = Worksheets("input").Cells(lPtr + 1, 2 + k).Value - sSlope * Worksheets("input").Cells(lPtr + 2, 1).Value

            'now solve for the interpolated value
            sTimeArray(i, k + 1) = sTimeArray(i + 1, 0) * sSlope + sB
        Next

    Next

    'now transfer this array to the sync tab
    Worksheets("input").Cells(6, 6).Resize(lDataPts, 4) = sTimeArray


End Sub
At this point the data table output will have constant sample-to-sample time intervals.
But what if those intervals are too short? Maybe your work involves measuring signals in the kHz range, but the sampled data is in the 10's of MHz?
To fix that, you can again resample, but this time you simple skip every so many data points. This in effect simulates an A/D that samples at a lower sample rate. This so-called "decimation" (not precisely correct since decimate implies "1 out of 10" being sampled and we can apply any ratio here) reduces the frequency response of the sampled signal while simultaneously increasing the frequency resolution.
Code Select
Private Sub cmdDecimate_Click()
    Dim gasCD_raw(600000, 4) As Single
    Dim gasCD_truc(600000, 4) As Single
    Dim i As Long, j As Long, k As Integer
    Dim iSkipValue As Integer

    j = 0
    iSkipValue = Worksheets("input").Range("a1").Value    'number of values to skip each time
    If iSkipValue < 1 Then iSkipValue = 10              'default to 10 if not given

    'transfer decimated data to array variable
    For i = 0 To 599999 - 3
        If i Mod iSkipValue = 0 Then
            For k = 0 To 3
                'transfer each element of row
                gasCD_truc(j, k) = Worksheets("input").Cells(6 + i, k + 6).Value
            Next
            j = j + 1
        End If
    Next
    Worksheets("input").Range("k6").Resize(j, 4) = gasCD_truc
    'put headers over this decimated data
    Sheets("input").Select
    Range("a5:d5").Select
    Selection.Copy
    Application.CutCopyMode = False
    Selection.Copy
    Range("k5").Select
    ActiveSheet.Paste

End Sub
An example spreadsheet is attached below. As I develop later versions, I'll include those too.
Starting with version 5 I sped up the algorithm by not performing as many back-and-forth operations between the underlying VBA code and the worksheet, so it runs quite a bit faster. Also cleaned up some bugs.
Here's a video tutorial on how to use that resampling and decimator spreadsheet.
I added some new features to this program starting in version 12 (V12), so here's a update tutorial video:
Finally, the program moving past version 12 is being called TBAD.xlsm (Time Base and Decimator). Note that V12 has a memory leak in the "Get Txt File" and the "Auto" function.
V13 (Jan-2018) Fixed the memory leak and added new features. First feature is it supports up to 800 000 rows and up to 36 columns of data. Previously a spreadsheet this sized crashed my 32-bit version of Excel even with 32 GB of RAM. Now I block switch memory in and out and can create spreadsheets of several hundred MB with no problem. Also this new version exports the "full" resolution as well as the decimated version of the resampled data as a CSV file to import into MATLAB or some other post-processing tool. You'll need to edit the path to where you want to store these files (I don't include a dialog... you'll need to edit VBA code... sorry... may add this in a future version.... in the meantime, follow the instructions below to change the path to the output directory for those CSV files.)
- Open the VB editor (Developer ->Visual Basic) in Excel and navigate to the "Code" module and then search (<Ctrl-F>) for the WriteCSV routine. Locate the SaveToDirectory string variable and change it to point to your desired path.
Both the full resolution and decimated data are written to this same path. The full resolution data has the same file name as the decimated data, except I append FR to the file name.
Example:- Decimated file name
t18_24_22-24s.csv - Full Resolution file name
t18_24_22-24sFR.csv
- Decimated file name
- Rename current columns
I was importing data from LTSPICE and the node names for currents in the exported data were not intuitive (e.g. Ix(x4:A1_OUT could be more descriptively written I4a, where '4' is bus 4 and 'a' is the A-phase). So this feature (which can be disabled via checkbox on this tab) is just a search and replace feature that allows you to use more descriptive names.
- Invert current values
Another byproduct of my LTSPICE export. The way I defined currents in the export resulted in the current values being 180 deg out of phase with the corresponding voltage signal. By checking this checkbox (it is as default), this program will invert by multiplying every instantaneous value for any column that includes "IX" (case insensitive) by -1 (new sample value = old sample value * -1).
Moved to a new naming scheme in early 2018 (TBAD)
- Runs much faster with less memory limits (haven't found largest spreadsheet supported yet)
- Many automated functions that can process directories of files rather than just files
Here's a very abbreviated tutorial on the new features. The important thing is that this version runs more reliably. But you'll need to open the VBA editor (like the other versions) and change the path to the destination directory for where you would write the output files created by this program (you can always just copy paste the data from the "resampled" and "decimate" tabs too.)